import matplotlib.pyplot as plt
import numpy as np

mario = plt.imread('mario.png')(255*mario[:5]).astype(int)[:, :, :-1]array([[[255, 164, 64],
[255, 164, 64],
[255, 164, 64],
[255, 164, 64],
[ 0, 0, 0],
[ 0, 0, 0],
[ 0, 0, 0],
[ 0, 0, 0],
[ 0, 0, 0],
[ 0, 0, 0],
[ 0, 0, 0],
[ 0, 0, 0],
[ 0, 0, 0],
[ 0, 0, 0],
[ 0, 0, 0],
[ 0, 0, 0],
[ 0, 0, 0]],
[[255, 164, 64],
[255, 164, 64],
[255, 164, 64],
[255, 164, 64],
[ 0, 0, 0],
[248, 56, 0],
[248, 56, 0],
[248, 56, 0],
[248, 56, 0],
[248, 56, 0],
[248, 56, 0],
[ 0, 0, 0],
[ 0, 0, 0],
[ 0, 0, 0],
[ 0, 0, 0],
[ 0, 0, 0],
[ 0, 0, 0]],
[[255, 164, 64],
[255, 164, 64],
[248, 56, 0],
[248, 56, 0],
[248, 56, 0],
[248, 56, 0],
[248, 56, 0],
[248, 56, 0],
[248, 56, 0],
[248, 56, 0],
[248, 56, 0],
[248, 56, 0],
[ 0, 0, 0],
[ 0, 0, 0],
[ 0, 0, 0],
[ 0, 0, 0],
[ 0, 0, 0]],
[[172, 124, 0],
[172, 124, 0],
[172, 124, 0],
[172, 124, 0],
[255, 164, 64],
[172, 124, 0],
[255, 164, 64],
[255, 164, 64],
[172, 124, 0],
[172, 124, 0],
[172, 124, 0],
[172, 124, 0],
[ 0, 0, 0],
[ 0, 0, 0],
[ 0, 0, 0],
[ 0, 0, 0],
[ 0, 0, 0]],
[[172, 124, 0],
[172, 124, 0],
[172, 124, 0],
[255, 164, 64],
[255, 164, 64],
[172, 124, 0],
[255, 164, 64],
[255, 164, 64],
[255, 164, 64],
[172, 124, 0],
[255, 164, 64],
[172, 124, 0],
[172, 124, 0],
[ 0, 0, 0],
[ 0, 0, 0],
[ 0, 0, 0],
[ 0, 0, 0]]])\[ \begin{bmatrix} 255 \\ 164 \\ 64 \\ \vdots \\ 0 \\ 0 \\ 0 \end{bmatrix} \]
fig, axes = plt.subplot_mosaic("AB;AC;AD", gridspec_kw={'width_ratios': [3, 1]}, figsize=(6, 4), dpi=150)
for i in 'ABCD':
    axes[i].set_xticks([])
    axes[i].set_yticks([])

axes['A'].imshow(mario, extent=(0, 17, 0, 16))

pixels = [(10, 8), (4, 4), (15, 1)]

for i, (x, y) in zip('BCD', pixels):
    axes['A'].add_patch(plt.Rectangle((x, y), 1, 1, edgecolor='green', fill=False))
    pixel_color = ', '.join([str(int(j*255)) for j in mario[15-y, x][:-1]])
    axes[i].imshow((mario[15-y:16-y, x:x+1]))
    axes[i].set_xlabel(f"{pixel_color}")

fig.subplots_adjust(left=0,right=1,bottom=0,top=1)
plt.tight_layout()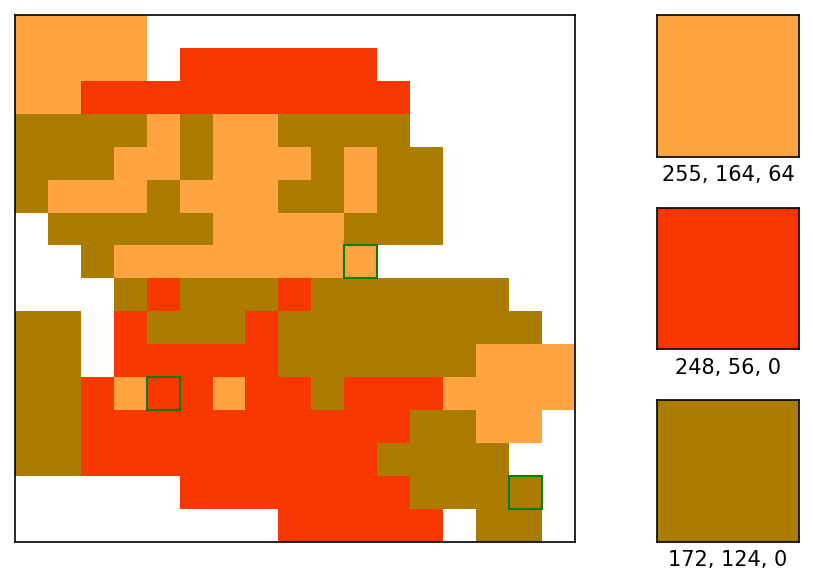
mario_grey = np.array([[i[:-1].mean() for i in j] for j in mario])

fig, axes = plt.subplot_mosaic("AB;AC;AD", gridspec_kw={'width_ratios': [3, 1]}, figsize=(6, 4), dpi=150)
for i in 'ABCD':
    axes[i].set_xticks([])
    axes[i].set_yticks([])

axes['A'].imshow(mario_grey, extent=(0, 17, 0, 16), cmap='grey', vmin=0, vmax=1)

pixels = [(10, 8), (4, 4), (15, 1)]

for i, (x, y) in zip('BCD', pixels):
    axes['A'].add_patch(plt.Rectangle((x, y), 1, 1, edgecolor='green', fill=False))
    pixel_color = str(int(mario_grey[15-y, x]*255))
    axes[i].imshow((mario_grey[15-y:16-y, x:x+1]), cmap='grey', vmin=0, vmax=1)
    axes[i].set_xlabel(f"{pixel_color}")

fig.subplots_adjust(left=0,right=1,bottom=0,top=1)
plt.tight_layout()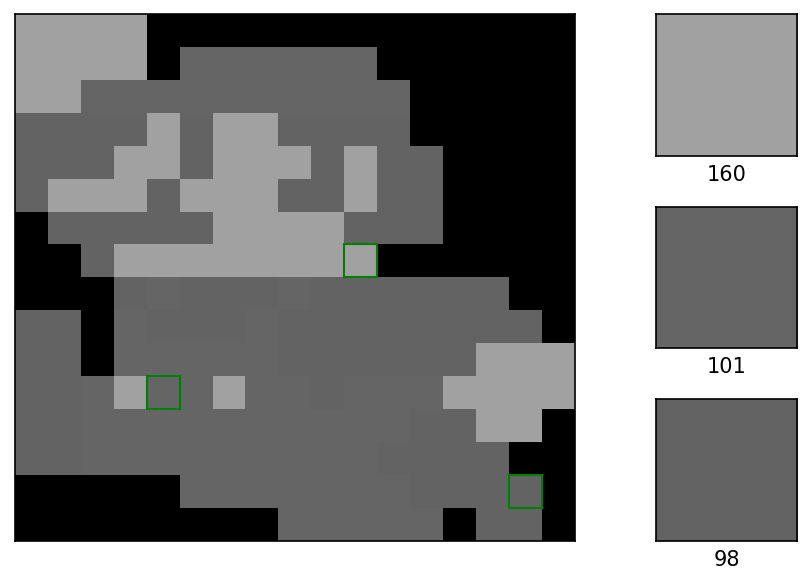
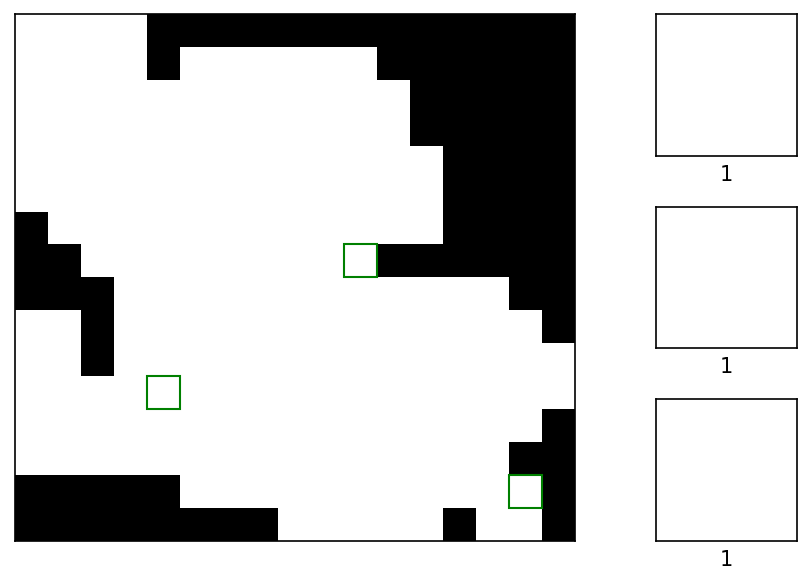
mario_bw = np.array([[i[-1] for i in j] for j in mario])

fig, axes = plt.subplot_mosaic("AB;AC;AD", gridspec_kw={'width_ratios': [3, 1]}, figsize=(6, 4), dpi=150)
for i in 'ABCD':
    axes[i].set_xticks([])
    axes[i].set_yticks([])

axes['A'].imshow(mario_bw, extent=(0, 17, 0, 16), cmap='grey', vmin=0, vmax=1)

pixels = [(10, 8), (4, 4), (15, 1)]

for i, (x, y) in zip('BCD', pixels):
    axes['A'].add_patch(plt.Rectangle((x, y), 1, 1, edgecolor='green', fill=False))
    pixel_color = str(int(mario_bw[15-y, x]*1))
    axes[i].imshow((mario_bw[15-y:16-y, x:x+1]), cmap='grey', vmin=0, vmax=1)
    axes[i].set_xlabel(f"{pixel_color}")

fig.subplots_adjust(left=0,right=1,bottom=0,top=1)
plt.tight_layout()